Designing the Jit Analytics Architecture for Scale and Reuse
When using serverless and event-driven architecture, the AWS building blocks available make it easy to design a robust and scalable analytics solution with existing data.
Updated February 28, 2024

Analytics has become a core feature when building SaaS applications over event-driven architecture, as it is much easier to monitor usage patterns and present the data visually. Therefore, it isn’t surprising that this quickly became a feature request from our clients inside our own SaaS platform.
This brought about a Eureka! moment, where we understood that at the same time we set out to build this new feature for our clients, we could also better understand how our clients use our systems through internal analytics dashboards.
At Jit, we’re a security startup that helps development organizations quickly identify and easily resolve security issues in their applications. Our product has reached a certain level of maturity, where it is important for us to enable our users to have a visual understanding of their progress on their security journey. At the same time, we want to understand which product features are the most valuable to our clients and users.
This got us thinking about the most efficient way to architect an analytics solution that ingests data from the same source but presents that data to a few separate targets.
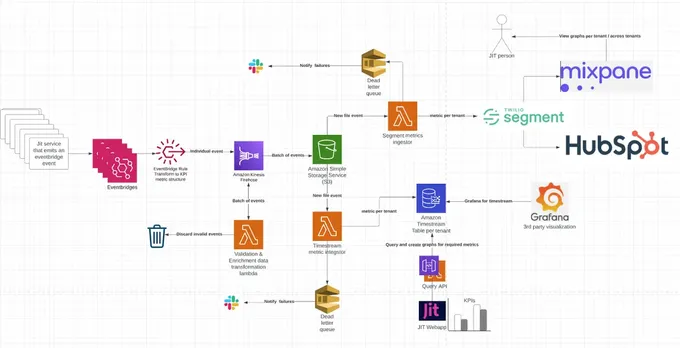
The first target is a customer metric lake, essentially an over-time solution that is tenant-separated. The other targets are 3rd party visualization and research tools for better product analysis that leverage the same data ingestion architecture.
At the time of writing, these tools are Mixpanel and HubSpot, both used by our go-to-market and product teams. This allows the aforementioned teams to collect valuable data on both individual tenant’s usage and general usage trends in the product.
If you’ve ever encountered a similar engineering challenge, we’re happy to dive into how we built this from the ground up using a serverless architecture.
As a serverless based application, our primary data store is DynamoDB; however, we quickly understood that it does not have the time series capabilities that we would require to aggregate and present the analytics data. Implementing this with our existing tooling would take much longer and would require significant investment for each new metric we’d like to monitor, measure, and present to our clients. So we set out to create something from scratch that we could build quickly with AWS building blocks and provide the dual functionality we were looking to achieve.
To create individualized graphs for each client, we recognized the necessity for processing data in a time series manner. Additionally, maintaining robust tenant isolation, ensuring each client can only access their unique data and thus preventing any potential data leakage, was a key design principle in this architecture. This took us on a journey to finding the right tools for the most economical job with the lowest management overhead and cost. We’ll walk through the technical considerations and implementation of building new analytics dashboards for internal and external consumptions.
Designing the Analytics Architecture
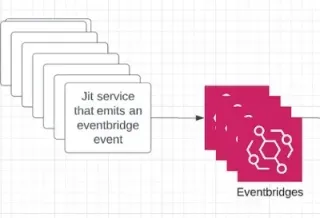
The architecture begins with the data source from which the data is ingested - events written by Jit’s many microservices. These events represent every little occurrence that happens across the system, such as a newly discovered security finding, a security finding that was fixed, and more. Our goal is to listen to all of these events and be able to eventually query them in a time series manner and present graphs that are based on them to our users.
Into the AWS EventBridge
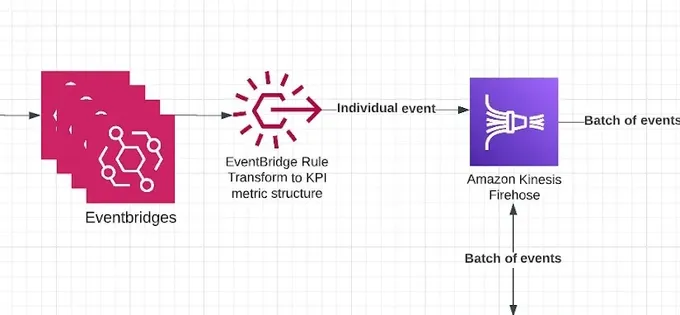
These events are then fed into AWS EventBridge, where the events are processed and transformed according to predefined criteria to convert them to a unified format that consists of data, metadata, and metric name. This can be achieved by using EventBridge Rules. Since our architecture is already event driven and all of these events are already written to different event bridges, we simply needed to add EventBridge Rules only in places where we wanted to funnel the "KPI-Interesting" data into the analytics feed, which was easy to do programmatically.
Once the data and relevant events are transformed as part of the EventBridge Rule, they are sent into Amazon Kinesis Firehose. This can be achieved with EventBridge Rule’s Target feature, which can send the transformed events to various targets.
The events that are transformed into a unified schema must contain the following parameters to not be filtered out:
- metric_name field, which maps to the metric being measured over time.
- metadata dictionary - which contains all of the metadata on the event, where each table (the tenant isolation) is eventually created based upon the tenant_id parameter.
- data dictionary - which must contain event_time which tells the actual time that the event arrived (as the analytics and metrics will always need to be measured and visualized over a period of time).
Schema structure:
{
 "metric_name": "relevant_metric_name",
 "metadata": {
   "tenant_id": "relevant_tenant_id",
   "other_metadata_fields": "metadata_fields",
   ...
 },
 "data": {
   "event_time": <time_of_event_in_UTC>,
   "other_data_fields": <other_data_fields>,
   ...
 }
}
AWS Kinesis Firehose
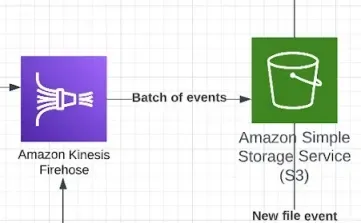
AWS Kinesis Data Firehose (Firehose in short) is the service that aggregates multiple events for the analytics engine and sends it to our target S3 bucket.
Once the number of events exceeds the threshold (which can be size or a period of time), these are then sent in a batch to S3 buckets to await being written to the time series database, as well as any other event subscribers, such as our unified system that needs to get all tenant events.
Firehose’s job here is a vital part of the architecture. Because it waits for a threshold and then sends the events as a small batch, we know that when our code kicks in and begins processing the events, we’ll work with a small batch of events with a predictable size. This allows us to avoid memory errors and unforeseen issues.
Once one of the thresholds is passed, Kinesis performs a final validation on the data being sent, verifies that the data strictly complies with the required schema format, and discards anything that does not comply.
Invoking a lambda that runs inside Firehose allows us to discard the non-compliant events and perform an additional transformation and enrichment of adding a tenant name. This involves querying an external system and enriching the data with information about the environment it’s running on. These properties are critical for the next phase that creates one table per tenant in our time series database.
In the code section below, we can see:
- A batching window is defined, in our case - 60 seconds or 5MB (the earlier of the two)
- The data transformation lambda that validates and transforms all events that arrive to streamline services and ensure reliable, unified, and valid events.
The lambda that handles the data transformation is called enrich_lambda. Note that Serverless Framework transforms its name into a lambda resource called EnrichDashdataLambdaFunction, so pay attention to this gotcha if you are also using Serverless Framework.
MetricsDLQ:
 Type: AWS::SQS::Queue
 Properties:
   QueueName: MetricsDLQ
KinesisFirehouseDeliveryStream:
 Type: AWS::KinesisFirehose::DeliveryStream
 Properties:
   DeliveryStreamName: metrics-firehose
   DeliveryStreamType: DirectPut
   ExtendedS3DestinationConfiguration:
     Prefix: "Data/" # This prefix is the actual one that later lambdas listen upon new file events
     ErrorOutputPrefix: "Error/"
     BucketARN: !GetAtt MetricsBucket.Arn # Bucket to save the data
     BufferingHints:
       IntervalInSeconds: 60
       SizeInMBs: 5
     CompressionFormat: ZIP
     RoleARN: !GetAtt FirehoseRole.Arn
     ProcessingConfiguration:
       Enabled: true
       Processors:
         - Parameters:
             - ParameterName: LambdaArn
               ParameterValue: !GetAtt EnrichDashdataLambdaFunction.Arn
           Type: Lambda # Enrichment lambda
EventBusRoleForFirehosePut:
 Type: AWS::IAM::Role
 Properties:
   AssumeRolePolicyDocument:
     Version: '2012-10-17'
     Statement:
       - Effect: Allow
         Principal:
           Service:
             - events.amazonaws.com
         Action:
           - sts:AssumeRole
   Policies:
     - PolicyName: FirehosePut
       PolicyDocument:
         Statement:
           - Effect: Allow
             Action:
               - firehose:PutRecord
               - firehose:PutRecordBatch
             Resource:
               - !GetAtt KinesisFirehouseDeliveryStream.Arn
     - PolicyName: DLQSendMessage
       PolicyDocument:
         Statement:
           - Effect: Allow
             Action:
               - sqs:SendMessage
             Resource:
               - !GetAtt MetricsDLQ.Arn
Below is the code for the eventbridge rules that map Jit events in the system to a unified structure. This EventBridge sends the data to Firehose (below is the serverless.yaml snippet).
A code example of our event mappings:
FindingsUploadedRule:
 Type: AWS::Events::Rule
 Properties:
   Description: "When we finished uploading findings we send this notification."
   State: "ENABLED"
   EventBusName: findings-service-bus
   EventPattern:
     source:
       - "findings"
     detail-type:
       - "findings-uploaded"
   Targets:
     - Arn: !GetAtt KinesisFirehouseDeliveryStream.Arn
       Id: findings-complete-id
       RoleArn: !GetAtt EventBusRoleForFirehosePut.Arn
       DeadLetterConfig:
         Arn: !GetAtt MetricsDLQ.Arn
       InputTransformer:
         InputPathsMap:
           tenant_id: "$.detail.tenant_id"
           event_id: "$.detail.event_id"
           new_findings_count: "$.detail.new_findings_count"
           existing_findings_count: "$.detail.existing_findings_count"
           time: "$.detail.created_at"
         InputTemplate: >
           {
             "metric_name": "findings_upload_completed",
             "metadata": {
               "tenant_id": <tenant_id>,
               "event_id": <event_id>,
             },
             "data": {
               "new_findings_count": <new_findings_count>,
               "existing_findings_count": <existing_findings_count>,
               "event_time": <time>,
             }
           }
Here we transform an event named "findings-uploaded" that is already in the system (that other services listen to) into a unified event that is ready to be ingested by the metric service.
Timestream - Time Series Database
While, as a practice, you should always try to make do with the technologies you’re already using in-house and extend them to the required use case if possible (to reduce complexity), in Jit’s case, DynamoDB simply wasn’t the right fit for the purpose.
To be able to handle time series data on AWS (and perform diverse queries) while maintaining a reasonable total cost of ownership (TCO) for this service, new options needed to be explored. This data would later be represented in a custom dashboard per client, where time series capabilities were required (with the required strict format described above). After comparing possible solutions, we decided on the fully managed and low-cost database with SQL-like querying capabilities called Timestream as the core of the architecture.
Below is a sample piece of code that demonstrates what this looks like in practice:
SELECT * FROM "Metrics"."b271c41c-0e62-48d2-940e-d8c80b1fe242"
WHERE time BETWEEN ago(1d) and now(
While other technologies were explored, such as Elasticsearch, we realized that they’d either be harder to manage and implement correctly as time series databases (for example, there would be greater difficulty with rolling out indexes and to perform tenant separation and isolation) or would be much more costly. Whereas with Timestream, a table per tenant is simple, and it is by far more economical, as it is priced solely by use. The pricing includes writing, querying, and storage usage. This may seem like a lot at first glance, but our comparison showed that with our predictable usage and the "peace of mind" that using it provides (given that it’s a serverless Amazon service with practically no management overhead), it is the more economically viable solution.
There are three core attributes for data in Timestream that optimize it for this use case (you can learn more about each in their docs):
- Dimensions
- Measures
- Time
The dimensions are essentially what describe the data, such as unique identifiers per client (taken from the user’s metadata) and environment in our case. The data is then leveraged to strip out the tenant_id from the event and use it as a timestream table name, which is how the tenant isolation is achieved. The remaining data enables partitioning by these fields, which makes it great for querying the data later. The more dimensions we utilize, the less data needs to be scanned during queries. This is because the data is partitioned based on these dimensions, effectively creating an index. This, in turn, enhances query performance and provides greater economies of scale.
Measures are essentially anything you require for incrementation or enumeration (such as temperature or weight). In our case, these are values we measure in different events, which works well for aggregating data.
Time is pretty straightforward; it is the timestamp of the event (when it was written to the database), which is also a critical function in analytics, as most queries and measurements are based on a certain time frame or window to evaluate success or improvement.
Visualizing the Data with Mixpanel and Segment
Once the ingestion, transformation, batch writing, and querying technology were defined, the dashboarding was easy. We explored the option of using popular open-source tools like Grafana and Kibana that integrate pretty seamlessly with Timestream; however we wanted to provide maximum customizability for our clients inside their UI. We decided to go with homegrown and embeddable graphs.
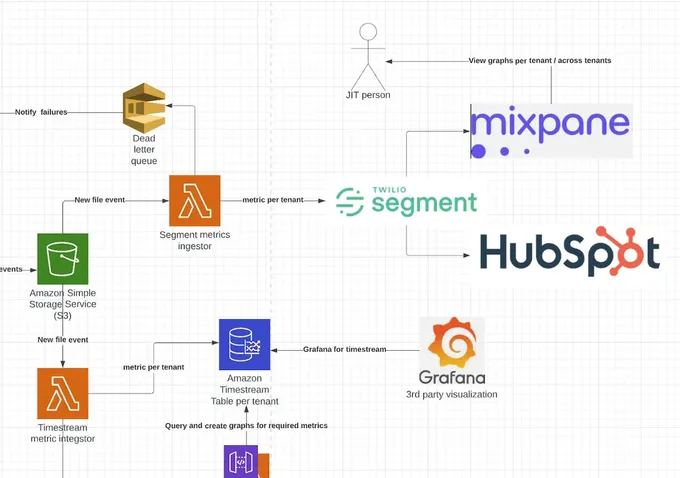
Once Firehose has written the data to the S3 in the desired format, there is a dedicated Lambda to read and then transform the data to a Timestream record and write it (as noted above, as a table per tenant, while utilizing `tenant_id` in the metadata field). Another lambda then sends this pre-formatted data to Segment and Mixpanel, providing a birds-eye-view of all the tenant data for both internal ingestion and external user consumption. This is where it gets fun.
We leveraged the Mixpanel and Segment data internally to build the UI for our clients by exposing the API that performs the query against Timestream (which is tenant separated by IAM permissions), making it possible for each client to only visualize their own data.
This enabled leveraging Mixpanel and Segment as the analytics backbone to give our clients Lego-like building blocks for the graphs our customers can consume.
Leveraging tools like Mixpanel and Segment enables us to have cross-tenant and cross-customer insights for our graphs, to optimize our features and products for our users.
Important Caveats and Considerations
When it comes to Timestream and deciding to go with a fully serverless implementation, this does come with cost considerations and scale limitations. We spoke about the Timestream attributes above; however, in each one, there is a certain threshold that cannot be exceeded, and it’s important to be aware of these. For example, there is a limit of 128 dimensions and a maximum of 1024 measures per table, so you have to ensure you are architecting your systems not to exceed these thresholds.
When it comes to memory, there are two primary configurations, memory and magnetic (i.e., long-term. Note that "magnetic" here refers to AWS Timestream’s long-term, cost-effective storage, not magnetic tapes). In contrast, memory storage is priced higher, but comes with a faster querying speed but with a limited window (2 weeks in our case). You can feasibly store up to 200 years of storage on magnetic, but everything has cost implications (we chose one year, as we felt that was sufficient storage - and it can be dynamically upgraded as needed). The great thing about AWS-based services is that much of the heavy lifting is done automatically, such as the data tiering automatically being migrated from magnetic to disk.
Other limitations include the number of tables per account (a 50K threshold), and there is also a 10MB minimum required for querying (and a 1-second querying time - which might not be as fast as other engines, but the cost was a significant enough advantage for us to compromise on query speed). Therefore, you should be aware of the TCO and optimize queries to always be above the 10MB limitation and even higher when possible, while also reducing latency for clients at the same time. A good method to combat this issue is to cache data, and not do a full query in real time, where you can consolidate data into a single query through unions.
Serverless Lego FTW!
By leveraging existing AWS services over serverless architecture, we were able to ramp up the analytics capabilities quite quickly, with little management and maintenance overhead with a low-cost, pay-per-use model that enables us to be cost effective. The greatest part of this scalable and flexible system is that it also provides the benefit of adding new metrics as our clients’ needs evolve.
Since all the events already exist in the system, and are parsed through event bridges, finding a new and relevant metric is an easy addition to the existing framework. You can create the relevant transformation, and have a new metric in the system that you can query nearly instantaneously.
Through this framework it is easy to add "consumers" in the future, leveraging the same aggregated data. By building upon serverless building blocks, like Legos, it was possible to develop a scalable solution to support a large and growing number of metrics in parallel, while future proofing the architecture as business and technology requirements continuously evolve.

