Introducing the new Teams View in Jit
Updated March 5, 2024

Jit has been evolving since Day 1 to focus on really delivering value as an end-to-end DevSecOps platform. This started by ensuring that all parts of the software stack are included in the security scanning and remediation––from code to CI/CD to cloud. Next on our list was to ensure it covers real-world use cases, and this started with real AppSec and Cloud Native Security plans, through OWASP Serverless Top 10, now through plans like AWS FTR.
After that we knew that no DevSecOps program is complete without actual KPIs - similar to DORA metrics, and we added insights to give real-world data on the evolution of your security programs and posture. Things that really matter to engineering managers and CTOs - time to remediation, time to coverage, and change failure rate in the form of vulnerabilities introduced, and other important data points.
Borrowing from the world of open source, we know no software stack is complete with openness and pluggability––and this is true for your DevSecOps platform too. Just like with all of our tools, we want consolidation and extensibility, and when possible, everything as code, and this has also been baked into Jit.
Now we’re happy to focus on supercharging your collaboration and transparency across engineering and security teams. One of the backbones of good DevOps is communication and collaboration, and this jointly owned and transparent view across teams creates greater visibility and ultimately ability to translate these to tasks and collaborate on their execution.
How it Works
In order to be seamless to the organization, the Teams-based view is simply plug and play, with no setup or overhead for the user. Once your organization onboards to Jit, you’ll immediately see the Teams tab and the data will automatically be updated directly from your Teams configuration in your Github Organization. In the future, we will make it possible to manually configure your teams setup, or modify it manually––but right now, you can enjoy the automagic of the integration with Github.
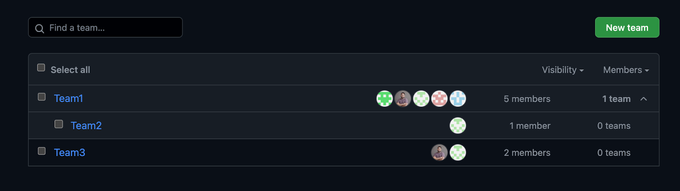
Through a simple listener, Jit is able to scan your Teams configuration in Github, and automatically represent this in your Jit dashboard, including all of the sub-teams and their hierarchy.
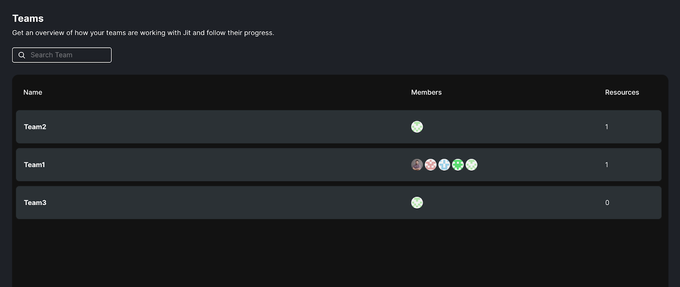
From within your Teams view you will be able to collaborate on issues related to your teams’ repos and projects, and work on remediating issues together. With a strong focus on transparency, this is a great place to delegate tasks through our Slack and JIRA integrations, and see the ownership for the different findings among the different engineering teams.
Each resource is tagged on the backend, which means that repos that belong to multiple teams can be visible to multiple teams, and in the future even other resources that belong to the team from applications to any other technical resource that needs security monitoring will be visible in the dashboard by team.
On Jit Teams and Scale - Under the Hood
One of the challenges when developing the feature was making sure that we can handle large organizations. Given that the feature is meant to work with small and large organizations and is activated as soon as the user onboards the platform, it was important to make sure that the initial synchronization of the user’s GitHub teams goes smoothly.
In order to import the data and display it to the users, we need to fetch:
- A list of the org’s GitHub teams
- A list of the repos that are attached to each GitHub team
- A list of GitHub users in each GitHub team
Even though the process is asynchronous and doesn’t pose any delay for the user, it still presents a challenge, as doing all that in a single AWS Lambda (which we use as part of our stack) is risky and bad practice, especially considering that large organizations can have hundreds of teams, with many users and repositories attached to each team.
In order to handle the scale, we used the help of SQS. The initial lambda, which is triggered when a user completes the onboarding process to the platform, only fetches the list of teams for the organization. For each team, an SQS message is sent, which triggers a lambda for each individual team. That lambda is responsible for fetching the users and repos only for that specific team, saves it to the database, and sends the relevant EventBridge event, so that other components know that a repo was attached or detached to/from a team.
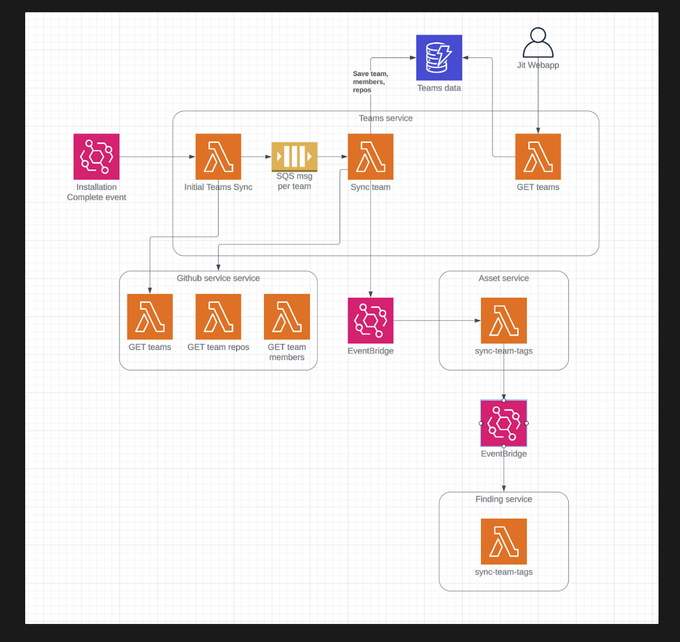
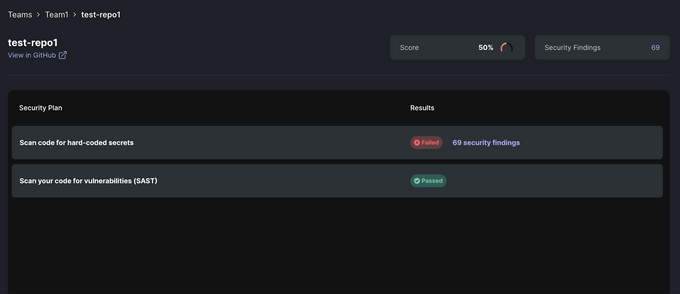
This allows us to later tag different resources, such as repos and security findings, as objects that relate to one or more teams. When that’s done - we can provide our users with a full team experience. This includes features like:
- Seeing security findings that fall under the responsibility of a specific team
- Sending relevant Slack notifications to specific teams
- Providing the team with actions that they can immediately take to improve their security posture.
With much more to come.
What Comes Next
Our Teams View is fresh out of the box, so we’d love to get your feedback on it––and also let us know what you are looking forward to seeing included. We want to focus our efforts and attention on the features our users really need, so chime in and let us know - would you prefer more granular filtering and assignment or better authorization and access to data?
Would you want to be able to have manual configuration and setup or integration with more tools? We’re only just getting started, and will be augmenting this view and tab to be as useful as possible to multi-disciplinary teams, so definitely let us know what you’re looking for.