7 Essential Steps to Correctly Calculate Change Failure Rate
Updated August 19, 2025

Let’s be honest: some software development changes are bound to fail. The increasing reliance on software systems means that the frequency and complexity of changes are constantly increasing. While you can’t always have pitch-perfect processes, you can bounce back quickly- and, thankfully, there’s a way to measure that.
Change Failure Rate (CFR) is one of the four key metrics of DORA Metrics. It enables you to measure the effectiveness of your company’s change management processes and identify areas for improvement. It’s a crucial metric to implement because it helps you gain valuable insights into the stability of your systems, processes, and technologies. That is - if calculated properly.
Unfortunately, calculating CFR isn’t as straightforward as it seems. So, in this article, we discuss seven essential steps to calculate this metric correctly and set you on your way.
Overview of Change Failure Rate
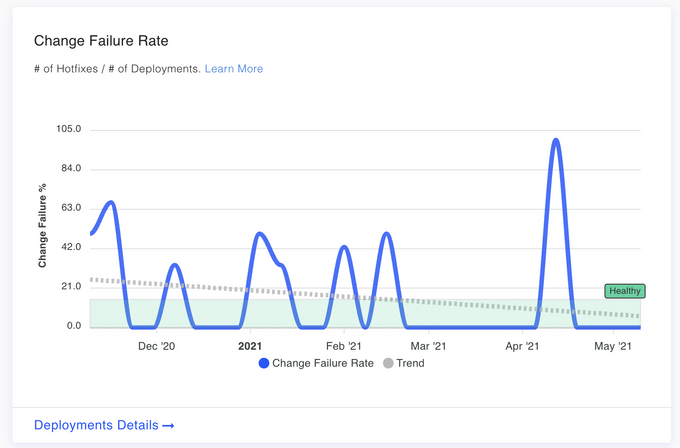
Change Failure Rate (CFR) is the percentage of changes that result in unintended consequences, such as downtime, errors, or negative impact on users. CFR is calculated by dividing the number of failed changes by the total number of changes made over a specific time.
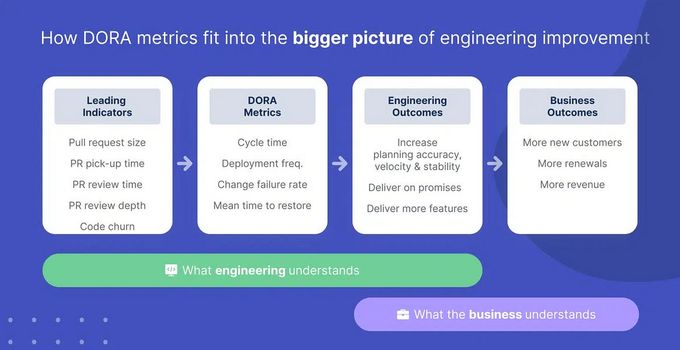
As we mentioned in the intro, CFR is part of the DORA Metrics, a widely recognized framework for measuring the performance of DevOps practices. The four DORA Metrics are:
- Lead Time for Changes
- Deployment Frequency
- Time to Restore Service
- Change Failure Rate
It is important to note that Change Failure Rate should not be confused with failure rate, which measures the rate of failure of a system or component. Change Failure Rate focuses specifically on the failures that result from changes made to the system or component.
A low Change Failure Rate is helpful for companies because it indicates a more stable and reliable IT environment. It also helps organizations identify areas for improvement in their change management processes, enabling them to prevent change failures and reduce the risk of downtime, lost productivity, and damage to reputation. By continuously monitoring and improving CFR, organizations can ensure that changes are implemented smoothly and with minimal disruption, leading to improved system stability and user satisfaction.
A change might fail do to internal processes built to surface issues in code before merging with the codebase, such as automated security scanning. With Jit, for example, you can fail pull requests if they contain a critical security vulnerability. Jit makes it easy for developers to surface and resolve security issues by integrating scanning and remediation fully into the developer environment.
Jit | The Open ASPM Platform

Empower developers to secure everything they code with a unified product security platform.
How to calculate Change Failure Rate
The formula to calculate Change Failure Rate (CFR) is as follows:
CFR = (Number of Failed Changes / Total Number of Changes) x 100
Where:
The to the system or component that resulted in unintended consequences or disruption.
The Total Number of Changes to the system or component over a specified time.
For example, over one month, a company made 100 changes to its IT system, and four resulted in unintended consequences or disruption. The CFR for that month would be:
CFR = (4 / 100) x 100 = 4%
So, the Change Failure Rate for the company's IT system for the given month is 4%. This result indicates that 4% of all changes made to the system resulted in unintended consequences or disruption.
What is a good Change Failure Rate?
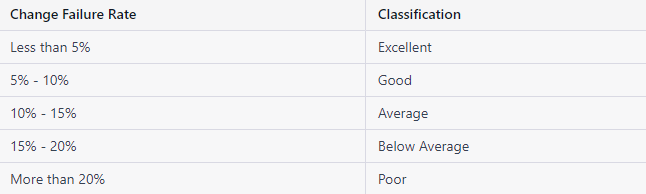
A "good" Change Failure Rate (CFR) depends on various factors, including the size and complexity of the IT system, the level of risk associated with changes, and the company's overall goals and objectives. However, as a general rule, organizations strive to keep their CFR as low as possible, ideally less than 5%.
This table provides a rough guideline for categorizing Change Failure Rates and can be used as a starting point to evaluate the stability and reliability of IT systems and processes.
7 essential steps to correctly calculate Change Failure Rate
Accurate calculation of Change Failure Rate (CFR) is crucial for organizations to understand the stability of their IT systems and make informed decisions to improve processes. However, there can often be confusion and inaccuracies in the calculation of CFR, leading to incorrect results that do not accurately reflect the team's performance.
1. Properly collect and tag your data
Organizations can ensure that their CFR reflects their IT processes by following proper data collection and tagging steps. Firstly, you need to define the scope of changes you will include in your CFR calculation and the details you need to decide the success or failure of changes.
Secondly, you need to define a change management system to track or log changes in a database. To tag data properly, include information such as the date of the change, the person who made the change, and its purpose. Make sure you regularly review and update the collected data to increase the accuracy of the results.
2. Define all your “fix-only” deployments
Define the number of "fix-only" deployments, or production deployments or releases solely for remediation, before calculating the Change Failure Rate (CFR). These deployments can include hotfixes, rollbacks, fix forwards, or patches and aim to resolve specific IT system issues.

3. Exclude “fix-only” deployments from the calculations
"Fix-only" deployments are not part of the standard feature or functionality releases. These types of deployments can affect the stability of the IT system but are not representative of the system's regular operation.
By excluding "fix-only" deployments from the calculation of the CFR, organizations can obtain a clearer picture of the stability of their IT system, free from the influence of remediation efforts.
4. Measure change failure, not deployment failure
Considering deployment failures as change failures is one of the common mistakes many developers make. They consider the percentage of workflows that failed to deploy into the production environment as the change failure rate. The deployment failure rate is significantly different from the change failure rate in the DORA metric, and it will only give you an indication of the quality of your CI/CD pipeline.
However, you need to connect the incident data with the deployment data to calculate the change failure rate correctly. Usually, incident data is stored in a separate system, and tools like PagerDuty are widely used for that.
5. Define the meaning of change failure
It is essential to define change failure in your own way. You have a certain degree of freedom for this since the DORA metric does not clearly define a degraded service or a change failure.
When deciding on a degraded service, you need to consider what kind of failures it causes, its impact on users, its severity, and the duration of the failures caused by the service. Then you can decide what failures you need to prioritize and devise a benchmark.
On the other hand, you can easily manipulate the change failure rate by decreasing the number of deployments and defining a more lax definition for a degraded service.
6. Exclude external incidents
External incidents refer to events outside the IT system and its teams' control, such as natural disasters, power outages, or network failures. These incidents may disrupt the regular operation of the IT system, but they are not caused by changes made to the system. Ensure you don’t count them when calculating CFR to avoid getting unrealistic results.
7. Understand the limitations of DORA Metrics
DORA categorizes the teams into four performance levels based on their change failure rate: This is known as binary categorization, and it does not depict the complexity of the software development and delivery processes. Furthermore, all the top three levels, elite
Also, DORA's team performance categorization does not consider factors such as deployment frequency, lead time, the number of deployed changes, or the unique circumstances of different organizations or projects like the size and complexity of the systems.
So, it is necessary to understand the DORA metric only provides a starting point for understanding team performance and has limitations on accurately reflecting the complexity of the IT system.
How to lower your Change Failure Rate
- Automate tests: Automated testing helps you catch issues early in the development cycle, reducing the risk of failure when deploying code to production.
- Incorporate tests into every pipeline stage: Ensure the code is thoroughly tested from development to deployment.
- Automate code reviews: Automated code reviews help to ensure that code is of high quality and meets the standards set by the organization.
- Only merge pull requests with a review: Multiple people should review the code before it is integrated into the main codebase to ensure that the code is of high quality and reduces the risk of bugs and failures when deploying it to production.
- Smaller deployments in more frequent intervals make testing and detecting bugs easier. This helps to reduce the risk of failures when deploying code to production, as issues can be caught early and addressed before they become more significant problems.
Increase security & lower the CFR
Correctly calculating the change failure rate is essential for organizations to get a realistic metric and better understand their team's performance. Following robust DevSecOps practices will help you avoid most failures in deployment processes. Jit unifies security tools and controls into all stages of your CI/CD pipeline and enables you to lower the CFR by reducing deployment failures. Book a demo and see how it works.